AIR POLLUTION IMPACT IN CALIFORNIA
Rodriguez, A., & Rodriguez, C.
2023
Mental health issues, including depression, are influenced by a number of factors, not only related to genetics or biological aspects, but also to social and environmental components. In the current article, some features of the surroundings where people live will be highlighted, as research has demonstrated that these conditions can contribute to both physical and mental health problems (Braithwaite et al., 2019; Snow et al., 2018).
In-depth discussion of the link between air pollution and mental health will be the focus of another article, whilst today the environmental impact in affected areas is the main topic. In the context of wildfires spread throughout the globe, it is vital to address the consequences these disasters bring to human lives. One of the main alterations refers to air pollution during wildfires seasons and long-after these occurrences. There are several pollutants in the atmospheric air (e.g., carbon monoxide, ozone, lead, particle pollutants, nitrogen and sulphur oxides), being particulate matter (PM) one of the most hazardous.
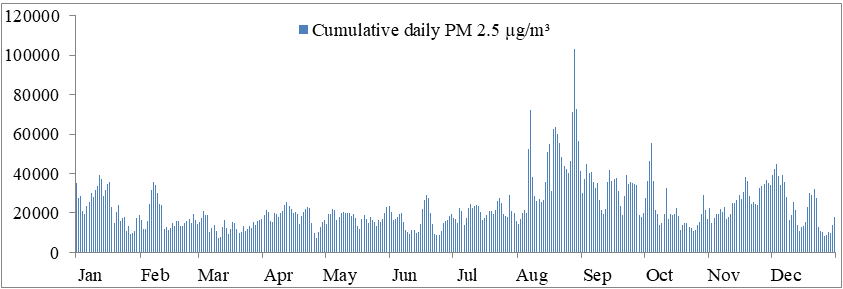
Within the United States, California has been greatly impacted by wildfires and air pollution. In 2021, August was the month with the highest pollutants levels of PM 2.5 µg/m³, being summer a period when wildfires tend to occur more often. Considering the top 10 days of cumulative PM 2.5 µg/m³ of the year, it is interesting to mention that all days were in August, except the 4th of October. The latter date could be related to a major spill of oil in the coast of the Pacific Ocean, on October 2nd, that might have endangered California´s environment and local species (Vigdor & Delkic, 2021). Possibly, this event caused a rise in the PM levels, as it was observed that the PM 2.5 µg/m³ concentration was highest on 4th October, however, started to increase from the 2nd to 4th of the same month (Environmental Protection Agency [EPA], 2022). The cumulative levels of PM 2.5 µg/m³, in 24 hours, from the several measurements FRM/FEM performed, in 2021, can be seen in Figure 1, where the mentioned spikes are spotted.
Figure 1. Cumulative daily Particulate Matter 2.5 µg/m³, in California, during 2021 (Source of data: Environmental Protection Agency, 2022; Data analysis and presentation performed by the authors).
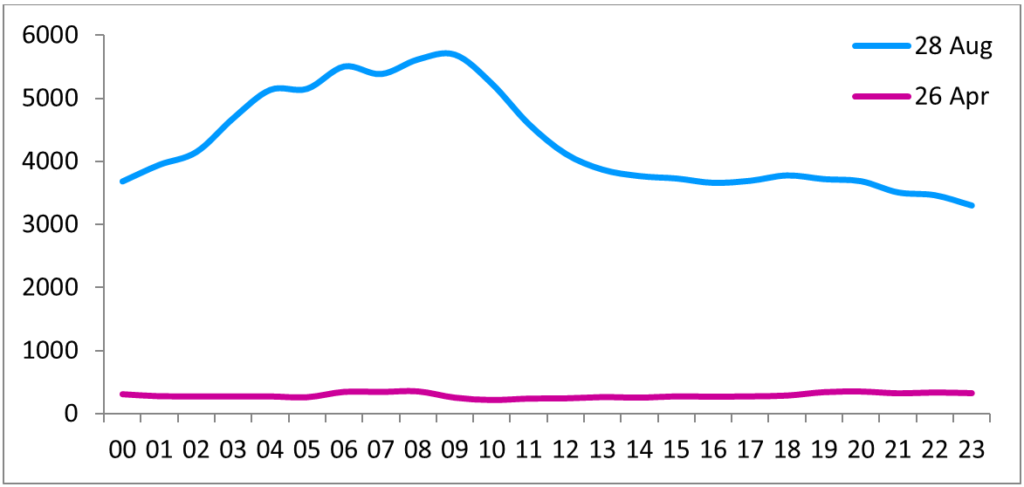
Hourly assessments of the days with extreme levels of this pollutant (28/08-26/04), in the same year, can be observed in Figure 2. We can notice a peak in the more polluted day, from 4:00 am until 10:00 am, when compared to reduced pollutant’s concentrations that remained constant within the 24 hours of the day with the lowest air pollution levels.
Figure 2. Cumulative hourly Particulate Matter 2.5 µg/m³, in California, on the highest and lowest polluted days of 2021 (Source of data: Environmental Protection Agency, 2022; Data analysis and presentation performed by the authors).
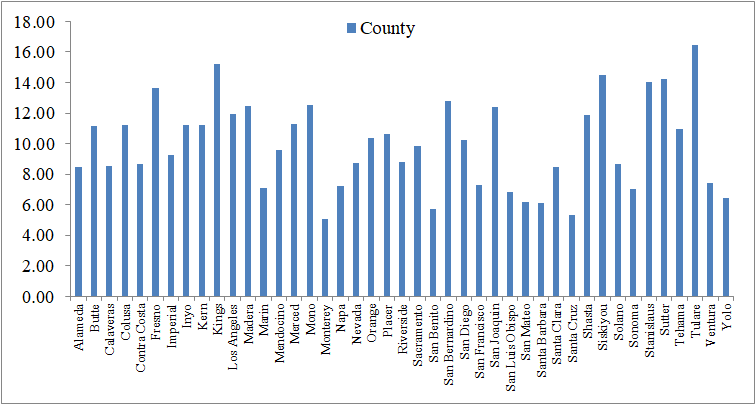
The average PM 2.5 µg/m³ concentrations, by all counties assessed in California, throughout the year 2021, positioned Tulare as the area with highest contamination, followed by Kings and Siskiyou, whereas the lowest levels were verified in Monterey, Santa Cruz and San Benito counties (Figure 3).
Figure 3. Average hourly Particulate Matter 2.5 µg/m³, in California, by county, in 2021 (Source of data: Environmental Protection Agency, 2022; Data analysis and presentation performed by the authors).
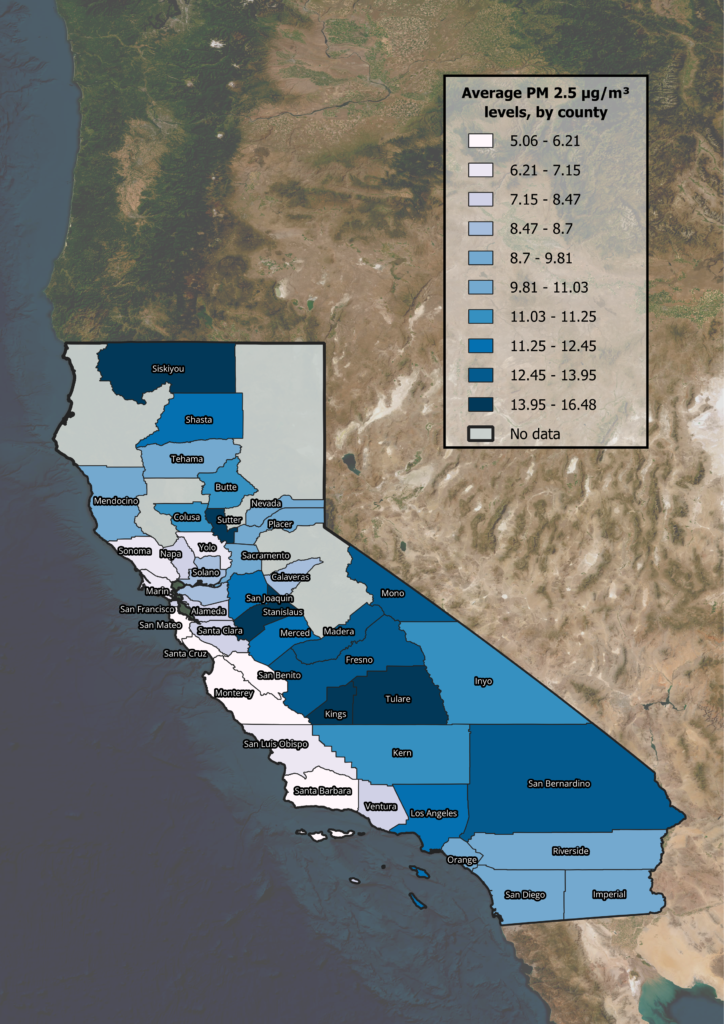
In the map below (Figure 4), the average PM concentrations can also be observed, varying the intensity in each Californian county. It is worth mentioning that the counties in the coast tend to have less contamination than inner territories, being some of these areas the places where land was burnt during wildfires.
Figure 4. Average hourly Particulate Matter 2.5 µg/m³, in Californian counties, during 2021 (Source of data: Environmental Protection Agency, 2022; Data analysis and presentation performed by the authors).
Climate change is closely related to the incidence and spread of wildfires, which, in turn, are responsible for the onset of diverse health issues. The consequences of these events comprise social and economic scopes, apart from the challenges for public health. Inhalation of air pollutants has been linked to depressive symptoms and suicidal behaviors (Braithwaite et al., 2019), thus being climate change an issue we all should consider in the fight against depression.
References٭
Braithwaite, I., Zhang, S., Kirkbride, J. B., Osbourne, D. P. J., & Hayes, J. F. (2019). Air pollution (particulate matter) exposure and associations with depression, anxiety, bipolar, psychosis and suicide risk: A systematic review and meta-analysis. Environmental Health Perspectives, 127(12): 126002. https://doi.org/10.1289/EHP4595
Environmental Protection Agency. (2022, November 14). Pre-generated data files. https://aqs.epa.gov/aqsweb/airdata/download_files.html
Snow, S. J., Henriquez, A. R., Costa, D. L., & Kodavanti, U. P. (2018). Neuroendocrine regulation of air pollution health effects: Emerging insights. Toxicological Sciences, 164(1), 9-20. https://doi.org/10.1093/toxsci/kfy129
Vigdor, N., & Delkic, M. (2021, October 3). ‘Major’ oil spill off California coast threatens wetlands and wildlife. New York Times. https://www.nytimes.com/2021/10/03/us/pipeline-broken-oil-pacific-ocean.html
٭Please note that in the website references might not show the original format.